
Introduction
Placed Order From MS Excel to Zerodha Kite using python and get live tick data in excel from Zerodha Kite to MS Excel, get Holding & Position live data in excel, get bhavcopy from NSE website.
PROS
- No requirement Kite Connect API Rs 2000/- per month & historical API additional Rs 2000/- per month
- Get live data from kite website to excel
- Get holding & position data to excel
- Place order with 3/4 seconds
- No requirement coding knowledge
- Get BHAVCOPY data
- Add symbol in watchlist
- Automatically place orders at specific time EX. 9:30:00
CONS
- Not get historical data like minute, hourly, daily, monthly
- No filter data in excel
- Logout when login from another pc or other browser
- 50 stock data at a time
Strategy
- open=low & open=high
- gap up and gap down strategy
- previous day high/low breakout strategy
- Pivot Point support resistance
- volume increase
system requirement
- windows 10/11 64 bit
- Latest version of google chrome and same version of chrome driver
How to use
NOTE :- Zerodha TOTP compulsory required in Google Authentication click below link for more detail.
SETP-1 DOWNLOAD AND UNZIP FOLDER
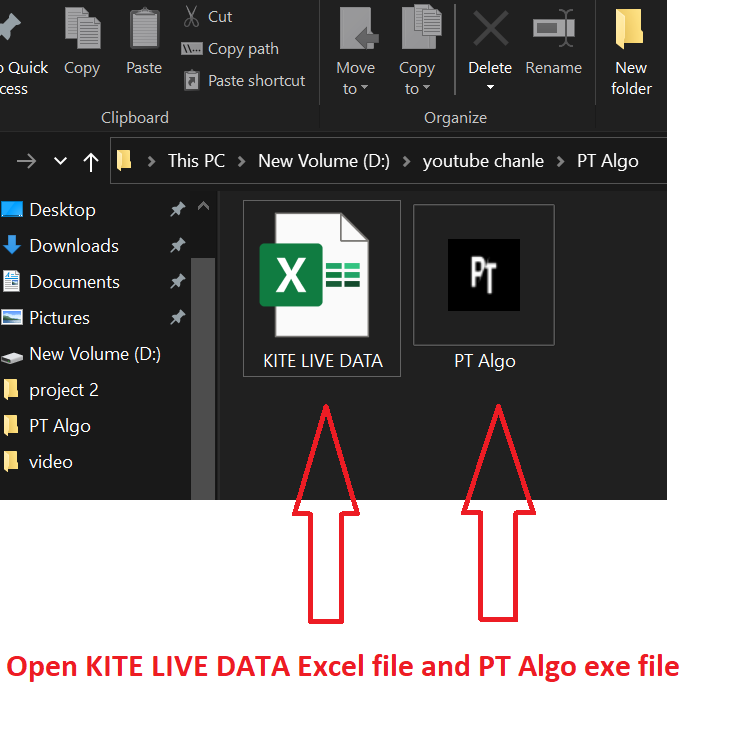
STEP-2 OPEN FILE
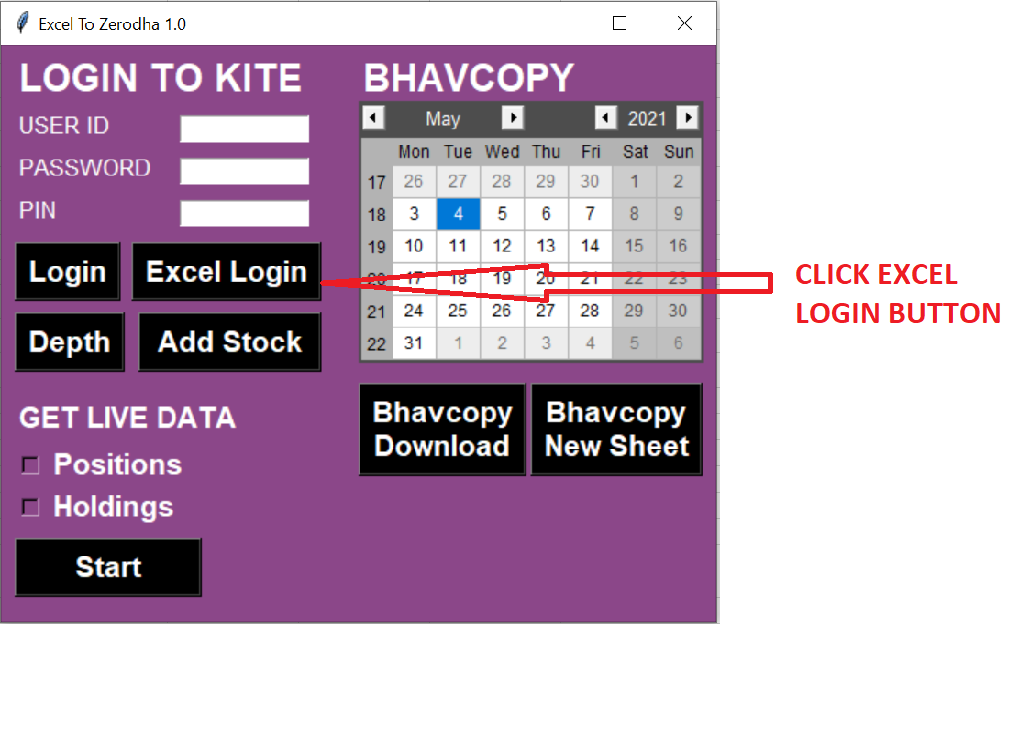
Login Step
Method-1
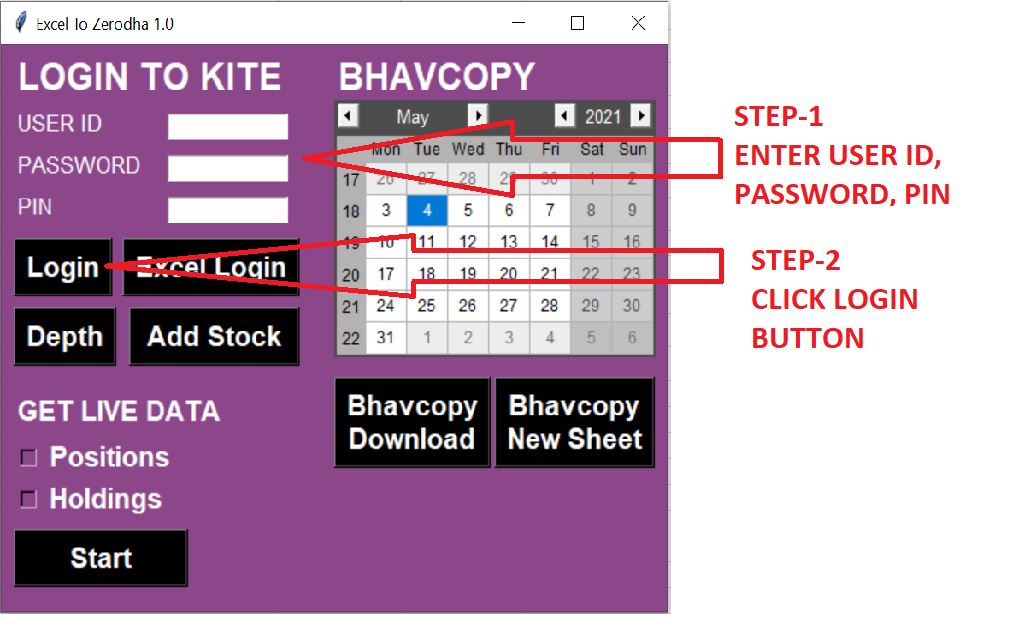
NOTE- in method-1 credentials not saved in the software
Method-2
STEP-1
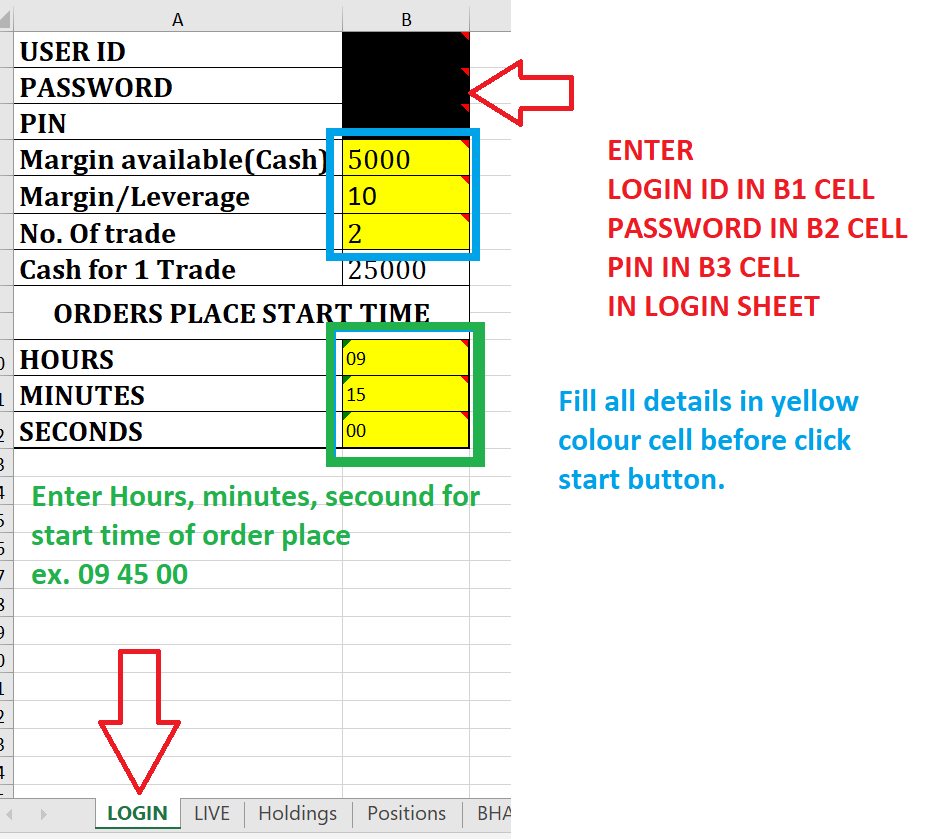
STEP-2
NOTE- in method-2 credentials are saved in an excel sheet, so users no need require to fill in credentials every time
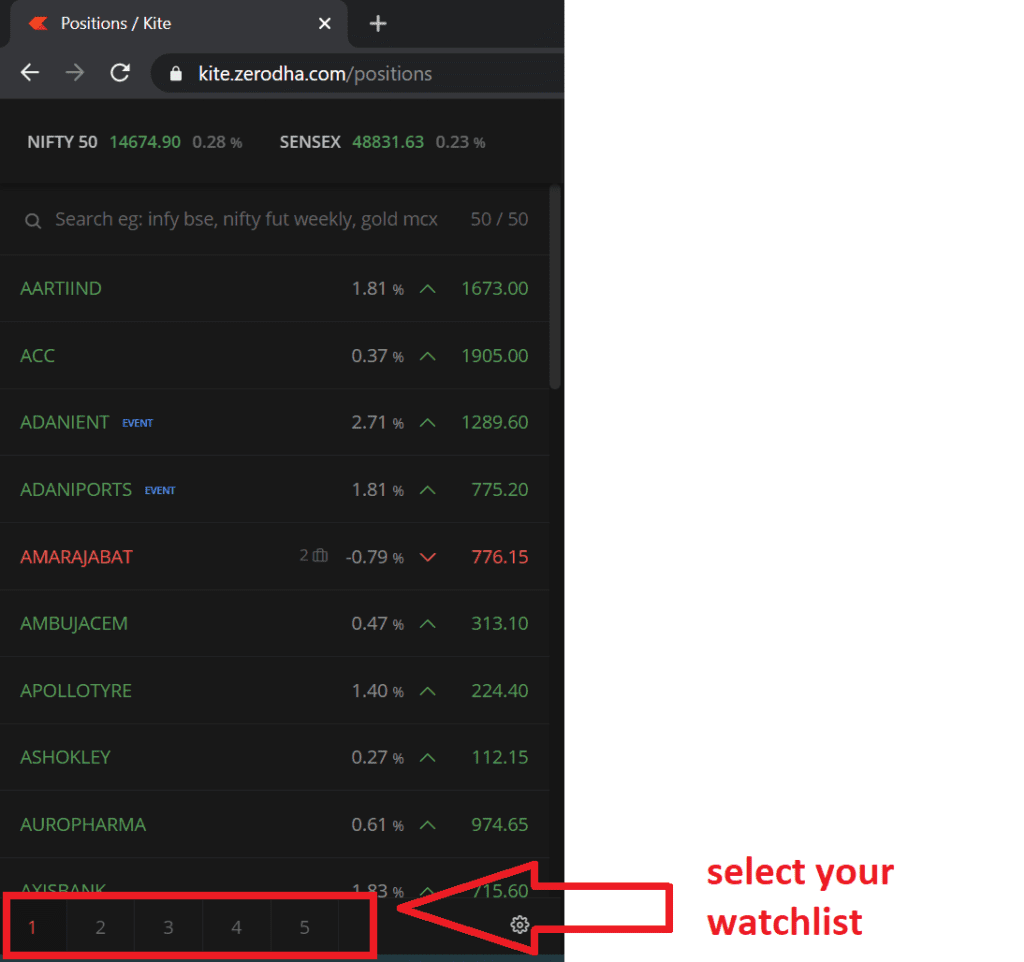
Watchlist Selection
When clicking the login button, automatically popup googles chrome window and log in to Kite website, based on your credentials, so make sure your credentials are correct and your internet connection is on.
After login, please select your watchlist no. 1 to 5
Open Market Depth
After selecting watchlist open market depth for OHLC data (Open, High, Low, Previous Close, Volume, Avg. Price)
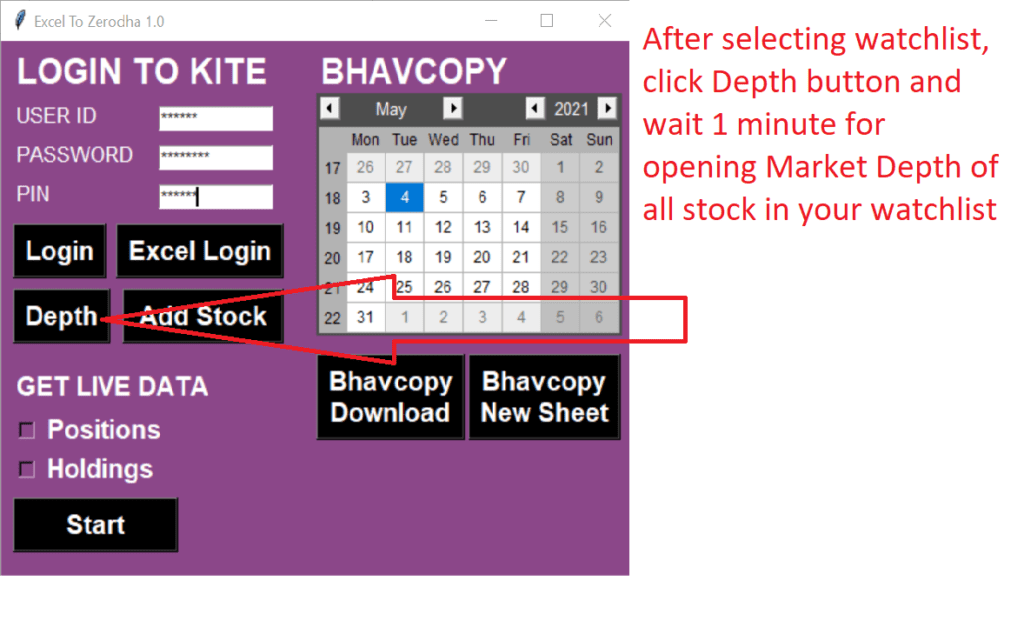
NOTE- If you don’t get OHLC data (Open, High, Low, Previous Close, Volume, Avg. Price) in the excel sheet then skip to open market depth, you get only the Last traded price, percentage change
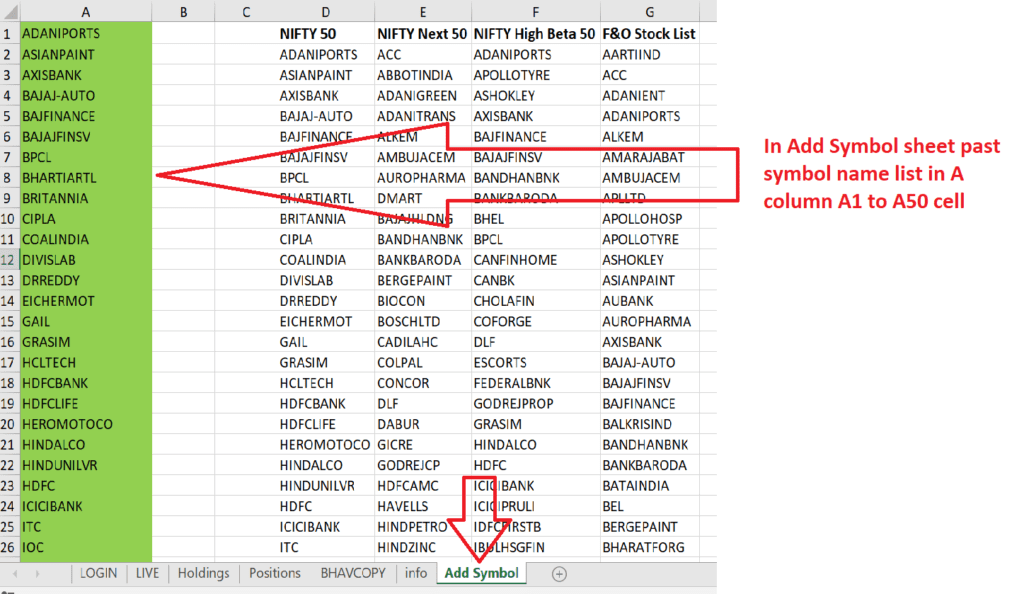
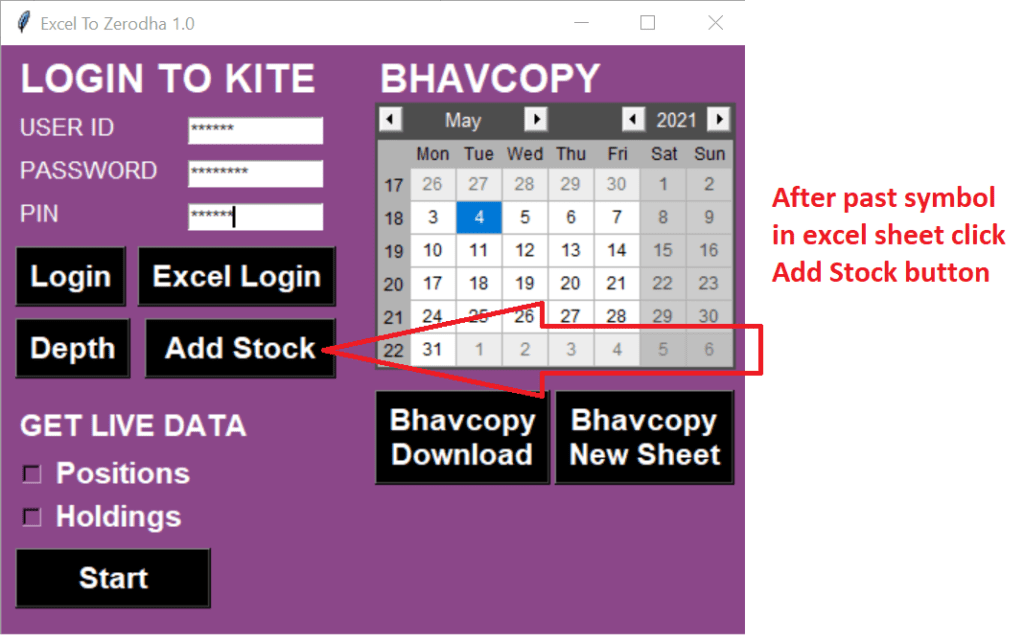
ADD STOCK IN WATCHLIST
From the excel sheet add multiple symbols to your watchlist, follow below step.
STEP-1 Select your watchlist and delete all existing symbols.
STEP-2
STEP-3
BHAVCOPY DATA IN EXCEL
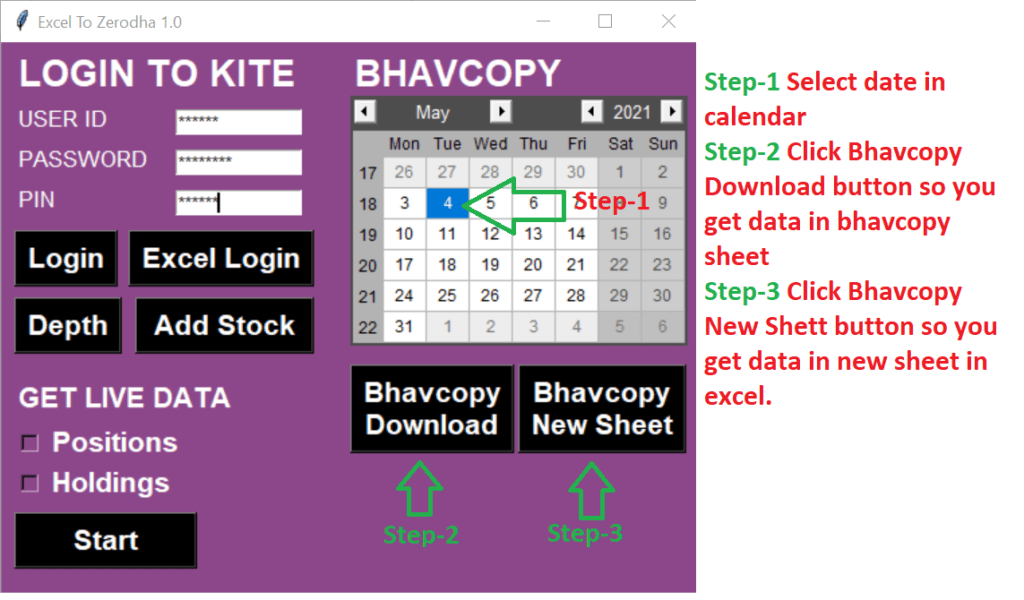
NOTE- BhavCopy data come from www.nseindia.com website.
So, you get data only that specified date available on the website, Not get future date bhavcopy data otherwise all become Warren Buffett.
PLACE ORDER & LIVE DATA
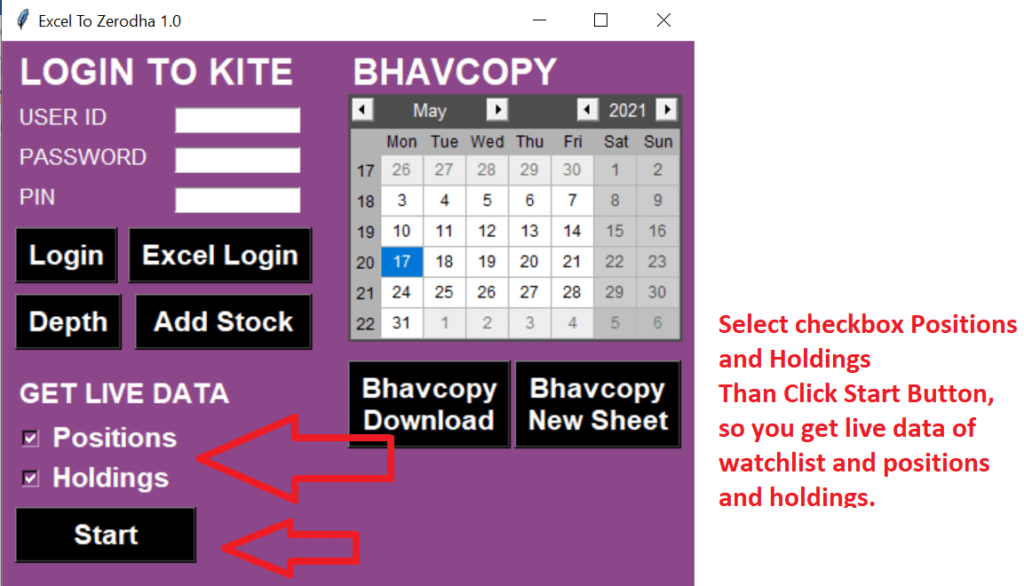
After clicking the Start button go to the workbook in Live sheet select Order details
| Exchange | Trading Symbol | Quantity | Order Type | Limit Price | Trigger Price | Complexity | Target Points | Stoploss Points | Intraday / Delivery | Trailing Stoploss |
| NSE | AARTIIND | 14 | MARKET | Regular | MIS |
After that, You can enter your formula based on your strategy.
for example, enter formulas in AC column for buy
=IF(D2=F2,”BUY”,””) if open = low then buy and
for example, enter formulas in AD column for sell
=IF(D2=E2,”SELL”,””) if open = high then sell
You can enter your formula based on your strategy.
NOTE: – don’t insert or delete columns or rows in any sheet of the workbook and don’t use Sort & Filter in any sheet of the workbook. For your strategy use column after AD column.
Sorry for my weak English.
Disclaimer
No refund No return, a refund will be not given in any situation.
THANK YOU